📈 Productivity Dashboard
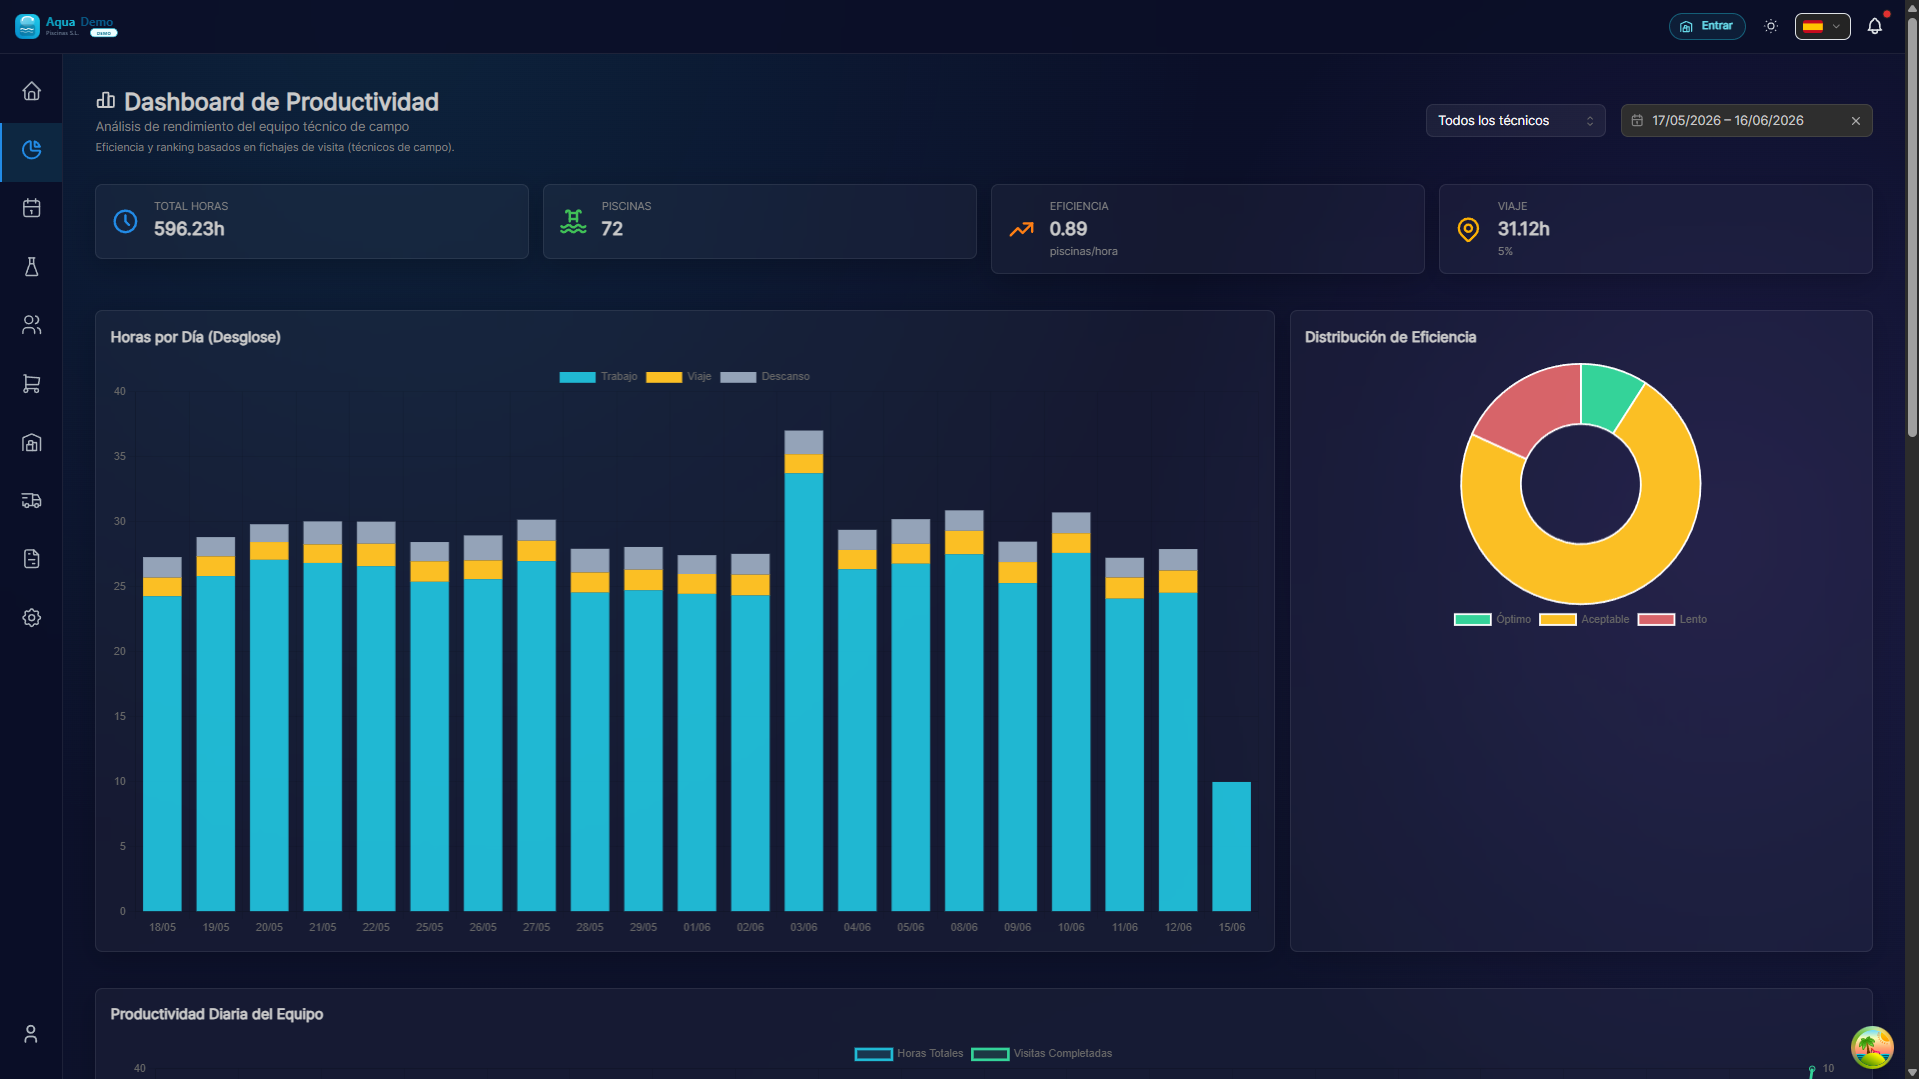
Captura con datos demo AquaDemo.Capture with AquaDemo demo data.
TL;DR
Visualize the performance of your team of technicians: how many visits they make, how long they take, how efficient they are. Compare between technicians and periods to identify areas of improvement.
Data requirements (signing)
For the dashboard to count pools, real time and efficiency per pool:
- The visit must be in Completed status.
- There must be a clocking (
TimeEntry) of type WORK_SHIFT in state COMPLETED, linked to that visit (visitId). - Travel is measured with completed TRAVEL signings (they do not add up to pools visited).
If there are visits completed but no clocking closed, the table shows No clocking in real time and status (not labeled as "Slow" by default).
What is it for?
Metrics you can see:
- 📊 Visits completed per day/technician
- ⏱️ Average time per visit
- 🎯 Success rate (visits completed vs canceled)
- 📍 Travel between pools
- 💰 Profitability per technician
Decisions it helps you make:
- Do you need to hire more technicians?
- Are there technicians who need training?
- Are the routes well optimized?
- Are you meeting SLAs with clients?
🟢 Main Dashboard
Access
Go to Reports → Productivity → Dashboard
Main widgets
🟡 Detailed Metrics by Technician
Click on a technician to see his profile:
FICHA DE PRODUCTIVIDAD - Juan García
Período: 1-15 enero 2025

📊 RESUMEN
├─ Visitas completadas: 68
├─ Visitas canceladas: 2
├─ Tiempo medio por visita: 42 minutos
├─ Kilómetros recorridos: 340 km
└─ Productos aplicados: 245 ítems

⏱️ ANÁLISIS DE TIEMPOS
├─ Trabajo efectivo: 47 horas (78%)
├─ Desplazamientos: 11 horas (18%)
├─ Pausas: 2 horas (4%)
└─ Total jornada: 60 horas

📈 EVOLUCIÓN (últimos 3 meses)
     Oct    Nov    Dic    Ene
Juan  7.2    7.8    8.5    9.1  visitas/día ↑
Media 7.0    7.0    7.0    7.0  (equipo)

🎯 EFICIENCIA
├─ Visitas dentro de tiempo estimado: 89%
├─ Clientes satisfechos (encuesta): 96%
└─ Revisitas necesarias: 3%
🔴 Comparison between Periods
Compare months to see trends:
COMPARATIVA: Enero vs Diciembre

                    Diciembre    Enero    Cambio
─────────────────────────────────────────────────
Visitas totales      1.180      1.247     +5.7% ↑
Tiempo medio         38 min     42 min    +10%  ↓
Tasa éxito           96%        94%       -2%   →
Km/visita            4.2        4.8       +14%  ↓
Productos/visita     3.1        3.6       +16%  ↑

INTERPRETACIÓN:
• Más visitas (bien) pero tardan más (revisar)
• Recorren más km (¿rutas mal optimizadas?)
• Usan más productos (¿piscinas más complejas?)
📊 Types of Charts
1. Bar Chart (Visits per day)
Quick view of weekly workload.
2. Pie Chart (Time Distribution)
TIEMPO JUAN GARCÍA - 8 horas

🟦 Trabajo efectivo  ████████████████ 78% (6.2h)
🟨 Desplazamientos   ████ 18% (1.4h)
🟥 Pausas/otros      █ 4% (0.4h)
3. Trend line (Monthly evolution)
See if productivity goes up or down over time.
4. Heat map (Visits by zone/time)
Identify patterns:
     Lun  Mar  Mié  Jue  Vie
08h  ██   █    █    ██   █
09h  ███  ██   ███  ███  ██
10h  ███  ███  ███  ███  ███
11h  ███  ███  ██   ███  ███
12h  ██   ███  ███  ██   ██
... (horario más cargado: 10-11h)
💡 Key Indicators (KPIs)
KPIs per technician
| KPIs | Goal | Good | Attention |
|---|---|---|---|
| Visits/day | 8 | >7 | <5 |
| Tiempo/visita | 40 min | 30-50 min | >60 min |
| Success rate | 95% | >90% | <85% |
| Revisitas | <5% | ❤️% | >10% |
| Km between visits | <5 km | <8 km | >12 km |
Global team KPIs
RENDIMIENTO DEL EQUIPO - Enero 2025

Capacidad vs Demanda
├─ Capacidad (técnicos × horas): 640 horas/mes
├─ Trabajo realizado: 580 horas
└─ Ocupación: 91% 🟢 (óptimo)

Distribución de carga
├─ Más cargado: Juan (105%)
├─ Equilibrado: María (98%), Ana (95%)
└─ Con capacidad: Carlos (78%)
📈 Automatic Reports
You can schedule periodic shipments:
CONFIGURAR REPORTE AUTOMÁTICO

☑️ Enviar cada lunes a las 8:00
☑️ Incluir: Productividad semanal
☑️ Destinatarios: gerencia@empresa.com
☐ Comparar con semana anterior
☑️ Destacar alertas (bajo rendimiento)
💡 Pro Tips
💡 Don't compare pears with apples A technician who goes to hotels (large pools) is not comparable to one who goes to chalets (small pools). Compare similar profiles.
💡 Contextualize the data If a technician's performance drops, look at the calendar: Was he on vacation? Were there festivities? Did they change the route?
💡 Speed is not everything A fast technician but with many return visits (unsatisfied customers) is worse than a slower one but who gets it right the first time.
💡 Use for training, not for sanctioning The dashboard should serve to identify who needs help or training, not to scold.
❓ Frequently Asked Questions
How is "working time" calculated? From when the technician marks "Start visit" until he marks "Finish". Includes measurements, tasks, product application.
Are trips measured by GPS? Yes, the technician's app records the distance traveled between pools.
What is a "revisit"? When the client reports that the problem was not solved and they have to return. Indicates possible poor execution.
Can I see productivity from 2 years ago? Yes, the system saves history indefinitely. But the GPS data is only available since you implemented the app.
See also
- Time & Clock-ins - Detailed analysis of signings
- Control Tower - Real-time location
- Configuración de Equipo - Manage technicians
Calculation Formulas
FÓRMULAS DE PRODUCTIVIDAD

Visitas por día = Visitas completadas ÷ Días trabajados

Tiempo medio = Suma(tiempo visitas) ÷ Nº visitas

Tasa de éxito = Visitas OK ÷ (Visitas OK + Revisitas)

Eficiencia ruta = Tiempo trabajo ÷ (Tiempo trabajo + Desplazamientos)

Ocupación = Horas trabajadas ÷ Horas disponibles

Producto por visita = Unidades consumidas ÷ Visitas