📈 Financial Dashboard
Estimated time: 10 minutes
Level: 🟡 Medium
The numbers that really matter
🎯 What is the Financial Dashboard?
It is the photo of how your company is doing financially.
Tells you:
- Do you win or lose money?
- What is your profit margin?
- Which clients are most profitable?
📊 Functional Status
| Functionality | Status | Notes |
|---|---|---|
| Profitability Report | ✅ Available | Revenue, costs, expenses, margin per client |
| Expenses | ✅ Available | Registration and categorization |
| Dashboard KPIs | ⚠️ Partial | Basic summary available |
| Balance Sheet | 📅 Coming soon | Full Active/Passive |
| Income Statement | 📅 Coming soon | Standard accounting format |
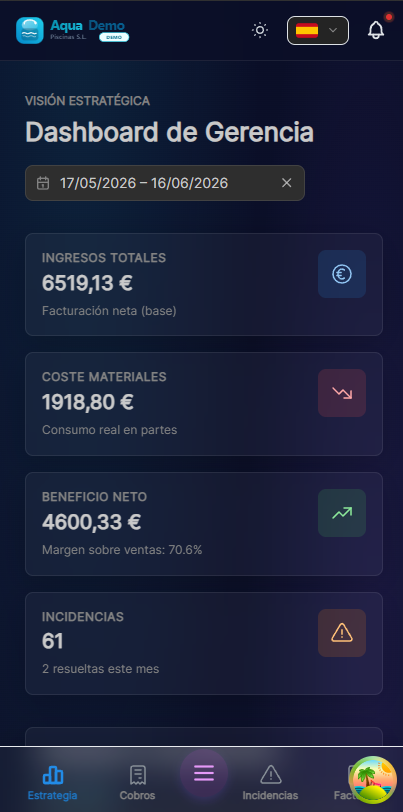
📊 General Summary
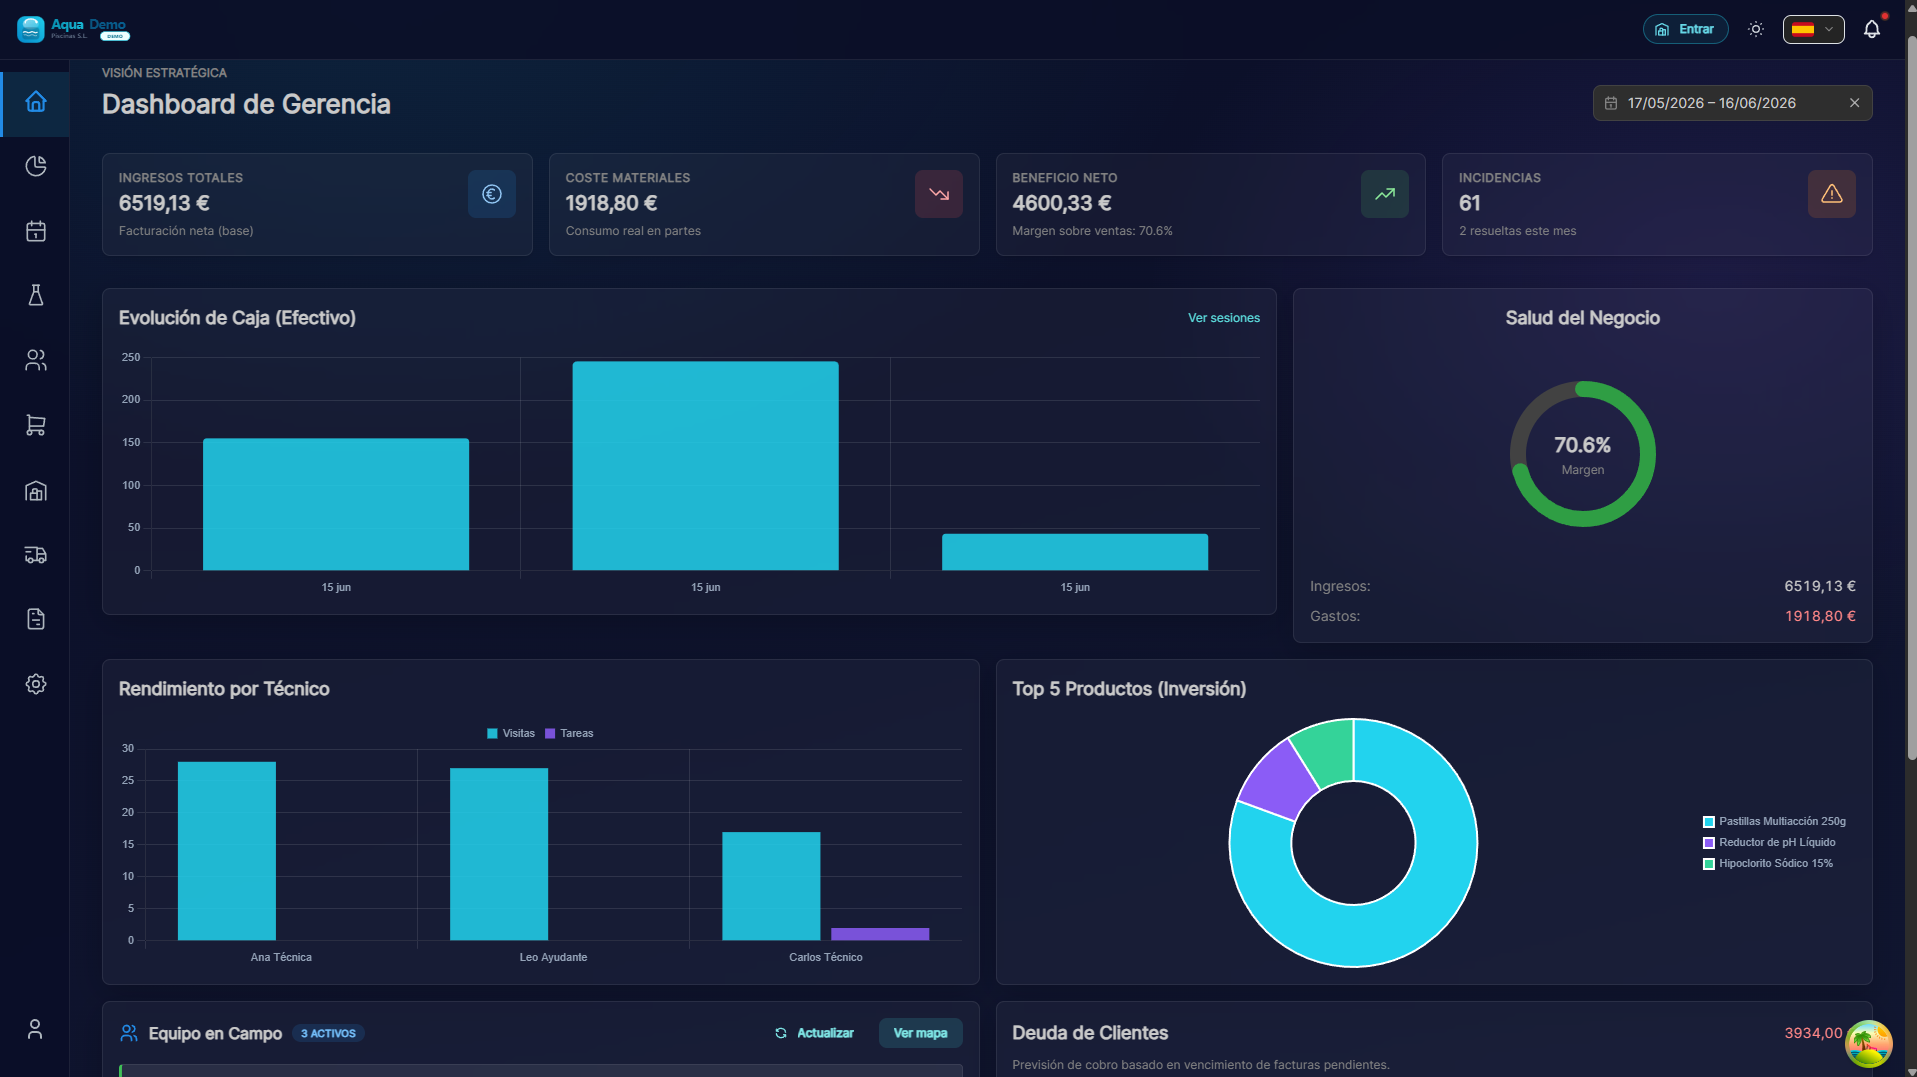
Captura con datos demo AquaDemo.Capture with AquaDemo demo data.Capture with demo manager user (AquaDemo data).
📋 Income Statement
The income statement (or profit and loss) shows:
Captura con datos demo AquaDemo.Capture with AquaDemo demo data.
What does each line mean?
| Concept | What is it |
|---|---|
| Revenue | Everything you bill |
| Expenses | Everything you spend |
| EBITDA | Profit before taxes and interest |
| Amortizations | Equipment expenditure spread over years |
| Net Result | What you really earn (your money) |
⚖️ Balance Sheet
The balance sheet shows what you have and what you owe:
Interpretation:
| Ratio | What does it mean | Healthy value |
|---|---|---|
| solvency | You can pay debts | > 1.5 |
| Liquidity | Do you have money available | > 1 |
| Indebtedness | How much you owe vs what you have | < 0,6 |
📈 Gráficos de Evolución
Comparativa año vs año:
INGRESOS MENSUALES
Comparativa 2023 vs 2024

     2023      2024
Ene: ████████  ██████████  (+25%)
Feb: ██████    ████████    (+20%)
Mar: ████████  ██████████  (+15%)
...

Tendencia: 📈 Creciendo
Evolución del beneficio:
BENEFICIO ACUMULADO 2024

Ene:  +8.588€ ████
Feb:  +15.200€ ███████
Mar:  +22.100€ ██████████
...

Objetivo anual: 100.000€
Vas por: 22% (vamos bien)
💡 Interpretar los datos
Situaciones típicas:
✅ EMPRESA SANA:
- Ingresos crecen
- Gastos controlados
- Beneficio positivo y creciente
- Solvencia > 2
⚠️ ATTENTION:
- Stagnant income
- Expenses grow more than income
- Margin going down
- More debts
🔴 DANGER:
- Losses (expenses > income)
- Lack of liquidity
- Many debts
- Clients do not pay
❓ Frequently asked questions
"Why doesn't the profit match the money in the bank?"
Because:
- There are clients who have not yet paid (accounts receivable)
- There are expenses that you will pay later (accounts payable)
- You have bought equipment (it made money, but it is an investment)
"What is a good profit margin?"
In pool maintenance:
- 20-30%: Normal
- 30-40%: Good
40%: Excellent
"How often to review the dashboard?"
- Weekly: Cash flow (money on hand)
- Monthly: Income statement
- Quarterly: Complete balance
✅ Review checklist
Monthly:
- [ ] Income vs previous month
- [ ] Expenses vs budget
- [ ] Profit margin
- [ ] Cash flow
Quarterly:
- [ ] Complete balance sheet
- [ ] Year vs year comparison
- [ ] Financial ratios
- [ ] Review with manager