📦 Consumption Reports
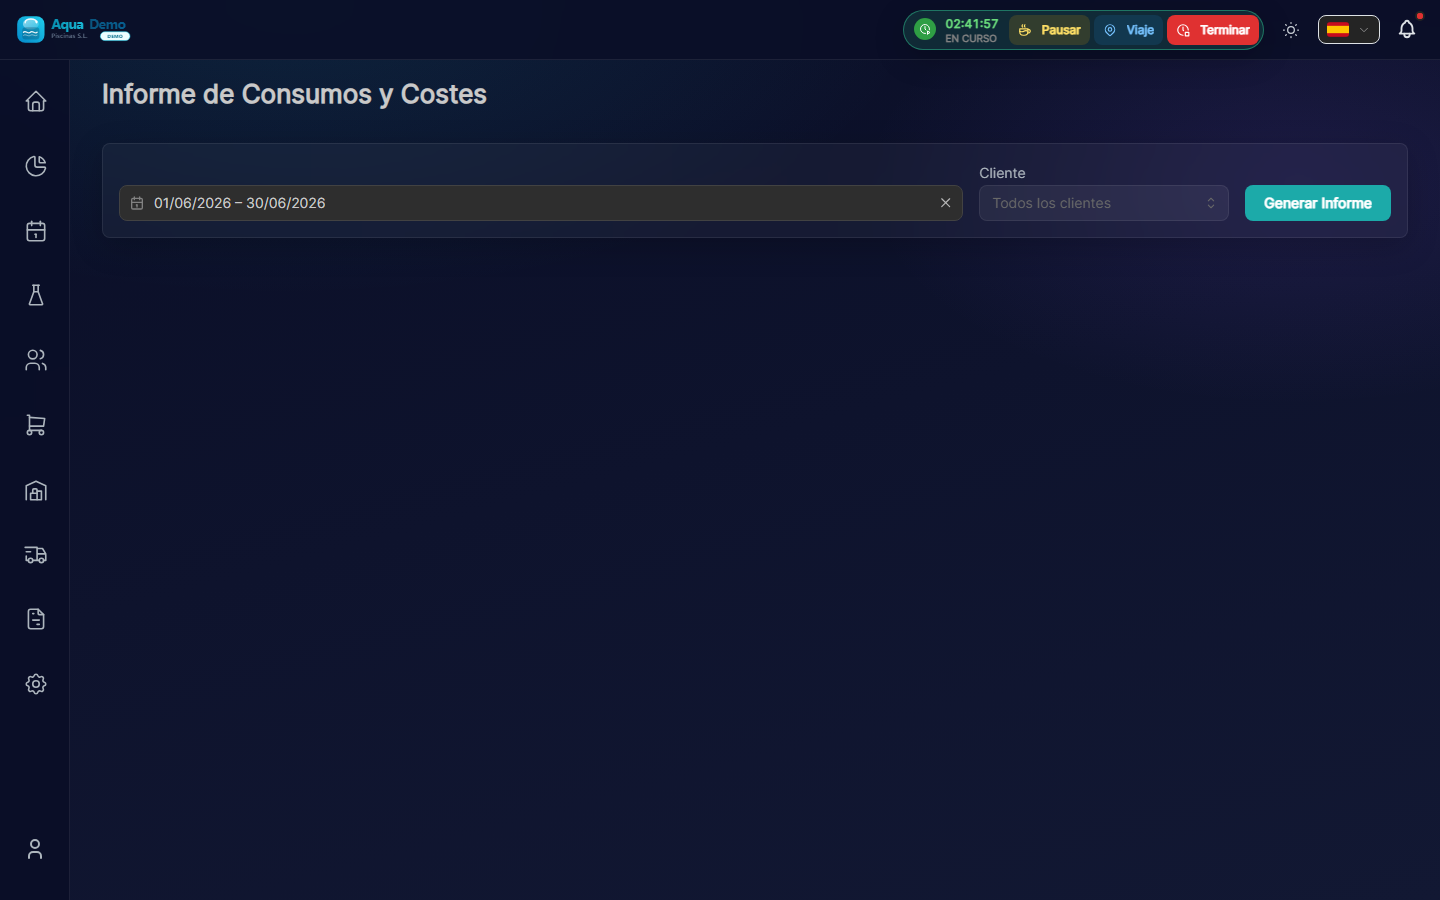
Captura con datos demo AquaDemo.Capture with AquaDemo demo data.
Estimated time: 8 minutes
Level: 🟢 Easy
Know what you use, how much and where
🎯 What do these reports measure?
They tell you what products you consume, in what quantity, where and who uses them.
Examples: -Did I use more chlorine this summer than last?
- Which technician uses the most products?
- Which client consumes the most chemicals?
📊 Consumption Dashboard
📋 Types of Consumption Reports
1. By Product
CONSUMO DE CLORO GRANULADO
Enero 2024

Semana 1: ████████ 200 kg
Semana 2: ██████████ 250 kg
Semana 3: ████████ 200 kg
Semana 4: ██████ 200 kg (incompleta)

Total: 850 kg
Media semanal: 212 kg

Tendencia: 📈 Creciente (más clientes activos)
2. Per Client
TOP CLIENTES POR CONSUMO (Cloro)
Enero 2024

Cliente              │ kg  │ %     │ vs mes ant.
─────────────────────────────────────────────────
Hotel La Palmera     │ 120 │ 14%   │ +5%
Comunidad El Sol     │  95 │ 11%   │ -2%
Hotel Costa Azul     │  80 │  9%   │ +10%
Casa García          │  45 │  5%   │ =
... (más 43 clientes)│ ... │ ...   │ ...
─────────────────────────────────────────────────
Total                │ 850 │ 100%  │
3. By Technician
CONSUMO POR TÉCNICO
Enero 2024

Técnico    │ Piscinas │ Cloro │ pH-  │ Algicida
           │ visitadas│ (kg)  │ (L)  │ (L)
─────────────────────────────────────────────────
Juan       │   85     │  280  │  60  │  28
Ana        │   92     │  295  │  62  │  30
Pedro      │   78     │  220  │  45  │  22
María      │   45     │   55  │  13  │   5
─────────────────────────────────────────────────

Consumo medio por piscina:
• Juan: 3,3 kg/piscina
• Ana: 3,2 kg/piscina
• Pedro: 2,8 kg/piscina ← Más eficiente
• María: 1,2 kg/piscina ← Rutas ligeras
4. By Season
CONSUMO ANUAL COMPARATIVO
Cloro Granulado (kg)

        2023    2024    Variación
Ene:     750     850      +13%
Feb:     700     ...        -
Mar:     800     ...        -
...
Jul:    2500     ...        -  ← Temporada alta
Ago:    2800     ...        -
Sep:    2200     ...        -
...
Total:  18500    ...        -

Predicción 2024: ~20.500 kg (+11%)
🔍 Consumption Analysis
Detect anomalies:
⚠️ CONSUMOS ANÓMALOS DETECTADOS

Cliente: Casa Rodríguez
Producto: Cloro
Consumo enero: 85 kg
Consumo habitual: 15 kg

Posibles causas:
[ ] Fuga en la piscina
[ ] Error de registro (técnico puso 85 en vez de 8,5)
[ ] Problema de filtración
[ ] Uso intensivo inusual

Acción recomendada: Revisar con técnico
Product efficiency:
COMPARATIVA PRODUCTOS (mismo resultado)

Reducir pH de 7,8 a 7,2 en piscina 50m³:

Producto A (pH- líquido): 2 L = 8€
Producto B (pH- sólido):  1 kg = 6€

Diferencia: 2€/aplicación
Ahorro anual estimado: 400€
📈 Predictions
The system can predict needs:
PREDICCIÓN DE CONSUMO
Próximos 3 meses (Feb-Mar-Abr)

Basado en:
• Histórico mismo periodo año pasado
• Clientes actuales
• Temporada esperada

Cloro:      2.400 kg  → Sugerido: 2.500 kg (+margen)
pH-:           480 L  → Sugerido:    500 L
Algicida:      240 L  → Sugerido:    250 L

Presupuesto estimado: 12.000€
💡 Tips
Tip 1: Review monthly
Identify trends before they become problems.
Tip 2: Compare with the same month last year
January vs January, not January vs December.
Tip 3: Investigate deviations
If a customer suddenly consumes twice as much, something happens.
Tip 4: Optimize purchases
Use predictions to negotiate with suppliers.
❓ Frequently asked questions
"Why does one technician consume more than another?"
It can be:
- It has more pools (normal)
- Larger pools
- Different products (liquid vs solid)
- Different application criteria
"Can I see consumption by individual pool?"
Yes, in the client details you can see the history of each pool.
"Do the reports include products sold in store?"
Yes, you can filter by type: pool consumption vs. customer sales.
✅ Analysis checklist
- [ ] Check monthly consumption
- [ ] Compare with previous month and previous year
- [ ] Identify clients with abnormal consumption
- [ ] Check efficiency by technician
- [ ] Adjust purchase predictions
📦 Know consumption = Buy better
Adjust purchases, detect problems, optimize resources.