Where are they in the app
Reports distributed: Finance (forecast, aging, treasury), Manager Strategy (profitability, productivity), Analytics Admin (consumptions, tax models, signings if TIME_TRACKING). Control tower: /team/live-tracking.
📈 Reports and Reports
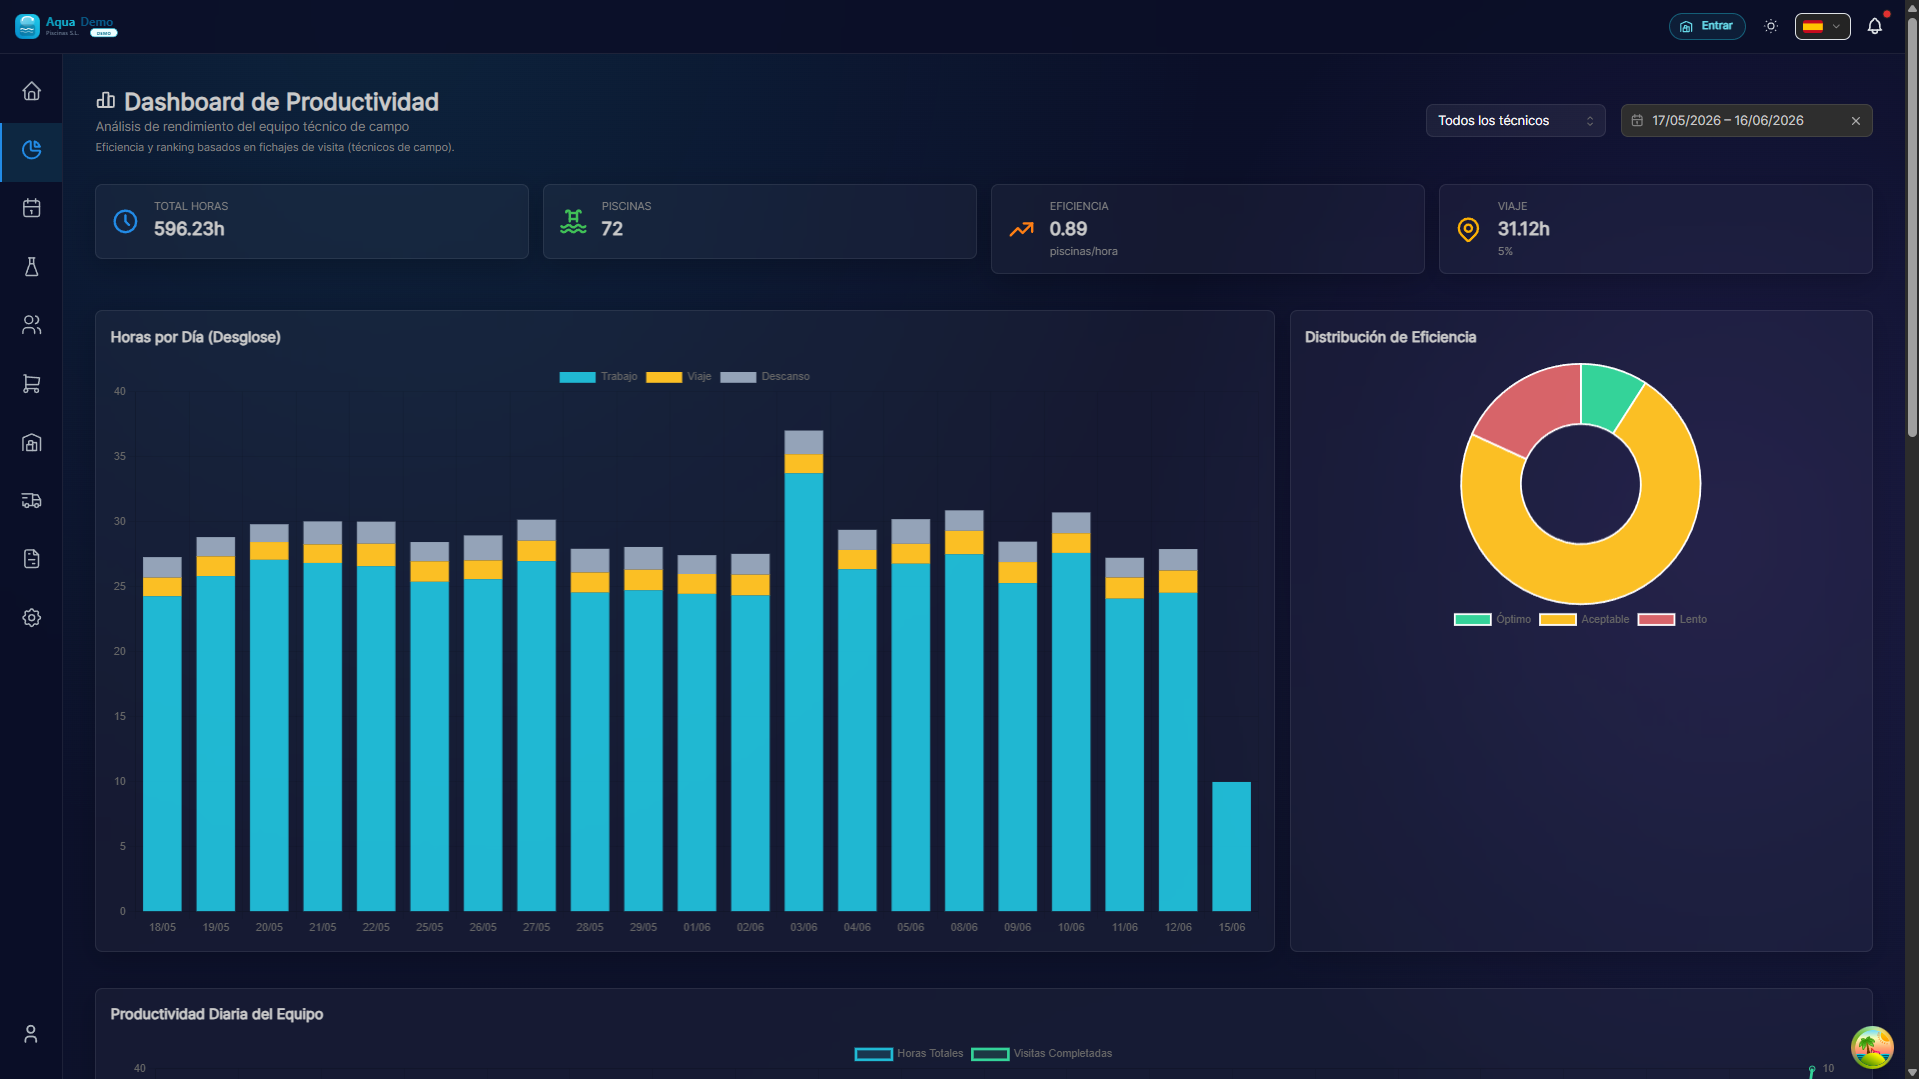
Captura con datos demo AquaDemo.Capture with AquaDemo demo data.
What will you learn here? How to leverage your company's data with detailed reports and analysis.
🎯 What are the reports for?
Reports transform data into useful information for making decisions.
Examples:
- What product do I use the most? → Consumption report
- Which technician is more efficient? → Productivity report
- How much do I earn per client? → Financial report
- Am I using more chlorine than last year? → Comparisons
🏗️ Types of Reports
| Category | What do they measure | Examples |
|---|---|---|
| Operational | Daily work | Consumption, visits made |
| Productivity | Efficiency | Times, pools/hour |
| Financials | Money | Income, expenses, benefits |
| From Clients | Behavior | Fidelity, satisfaction |
📋 What can you do here?
✅ Consumption and Products
- What products are used the most
- Consumption per client, pool, technician
- Season comparisons
- Prediction of needs
✅ Times and Productivity
- Hours worked per technician
- Average time per pool
- Route efficiency
- Displacements
✅ Financial
- Revenue per typical client
- Profitability per service
- Monthly/annual evolution
- Year vs year comparisons
✅ From Clients
- Retention rate
- Satisfaction (if there are surveys)
- Incidents per client
- Customer value (LTV)
🗺️ Navigation map
📁 REPORTS
│
├── 📦 [Consumption & Products](./consumption)
│   └── What is used, how much and where
└── 💰 [Financial](./financial)
    └── Revenue, profitability, loyalty
🎓 Glossary
| Term | Meaning |
|---|---|
| KPIs | Key performance indicator |
| Benchmark | Comparison with standard |
| Trend | Evolution over time |
| Deviation | Difference from what was expected |
| Accumulated | Progressive sum (ex: year) |
💡 When to use each report?
I want to adjust material purchases:
→ Go to Consumptions → See usage trends
I want to know if I need more technicians:
→ Go to Productivity → Hours per technician
I want to see if I improve compared to last year:
→ Go to Financials → Annual comparison
I want to identify problem clients:
→ Go to Customers → Incidents and satisfaction
📈 Well analyzed data = Better decisions
Without measuring you cannot improve. The reports give you the vision.